
How Does Demand Forecast Accuracy Impact the Business?
June 30, 2022
by Farshad Kheiri, PhD

To quantify the impact of increase and decrease in accuracy on a business, first, we need to identify how the accuracy is measured. There are different ways to measure forecast accuracy. All of the main methods, such as MAPE, SMAPE, WFA, depend on the absolute values of differences between the forecasts and the actuals.
If: ƒ = g⁄h
If: ƒ ↑ ⇒ g ↑ or/and h ↓ (if ƒ increases, it means g increases or/and h decreases.)
If: ƒ ↓ ⇒ g ↓ or/and h ↑ (if ƒ decreases, it means g decreases or/and h increases.)
Here, we will focus on one of the above-mentioned metrics, MAPE, as it is the most accepted by the industry. MAPE is defined as follows:
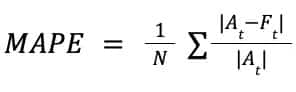
Where At is the actual at time t and Ft is the forecast at time t.
If MAPE increases/decreases x%, assuming |At| is constant and |At - Ft| has to increase/decrease the same amount. If we use MAPE as measurement of error, the accuracy is 1 - MAPE.
Based on the above, we can conclude that Accuracy ≃ |Actuals - Forecasts| where ≃ means proportional.
The other assumption we’re making is that labor and demand forecast accuracies are linearly related and although we won’t be discussing that here, this does not mean that labor and demand are linearly related themselves. Obviously labor and demand could have “step function relationships”, as labor changes, and if demand passes some thresholds.
Having a fair forecast where under and over forecasts are equally probable, 10% differences in two accuracies can be as a result of 5% under forecasts and 5% over forecasts. This means for 100 hours of labor, half of it would be under forecasting 5 hours. Under forecasts can be made up by an employee working extra hours, which means breaking compliance laws or missing on sales. Employees may stretch and cover up to 50% of the miscalculated (under forecasted) hours, however the other 50% of the extra labor remains unaddressed and will translate to missing sales. But, how much will those missing sales cost? If we assume a linear relationship between demand and labor, missing 2.5% of demand can be the result of 5% under forecasting the labor. The missing demand could be sales, which would result in 2.5% lost revenue. In other cases, it could be missing traffic, which for some retailers, like the food industry, could be converted to the same amount of missed sales. For other industries, the missing demand could be proportionally interpreted as missing sales because they predict , one out of every ten customers leads to a sale, for example in this case, instead of losing 2.5% sales, it will be 0.25% loss in sales.
As a result of under-forecasting, employees can be required to work extra hours which would result in fatigue and potential dissatisfaction. This not only causes employee attrition, but it also increases the risks and costs associated with breaking workforce compliance laws. With over forecasting, the company can be hit with unplanned and non-budgeted overtime, which would increase labor costs. This can be quantified based on the company's monthly labor hours.
For the second part of the miscalculation of demand forecasting, for the other 50 hours an extra five hours is paid due to over forecasting.
Rule of Thumb
If the accuracy improves by just 1%, it means your labor accuracy increases 0.5%, which can be translated to direct savings. The other 0.5% ensure your employees work the appropriate amount and have their allotted breaks, directly impacting employee satisfaction and retention while also complying with company and labor laws, and leading to a 0.25% increase in sales (in most cases).
A decrease in demand forecasting by just 1% can increase your labor costs by 0.5%, reduce sales (revenue) by 0.25% and potentially result in worker fatigue due to shorter breaks. Workers become burned out and dissatisfied resulting in increased attrition.
Learn More
To see how your business can use Legion Demand Forecasting to increase accuracy, please request a demo.

Ready for a Demo?
See how Legion's WFM Software enables intelligent automation to help you maximize labor efficiency and employee engagement simultaneously.